HunchBuzz Reporting & Analytics
The most important part of gathering ideas and feedback is knowing what's going on! HunchBuzz provides a host of ways to monitor your community, challenges and ideas. The admin dashboard provides a quick snapshot at a glance while our comprehensive reporting lets you explore and analyze what's happening—and what action to take.
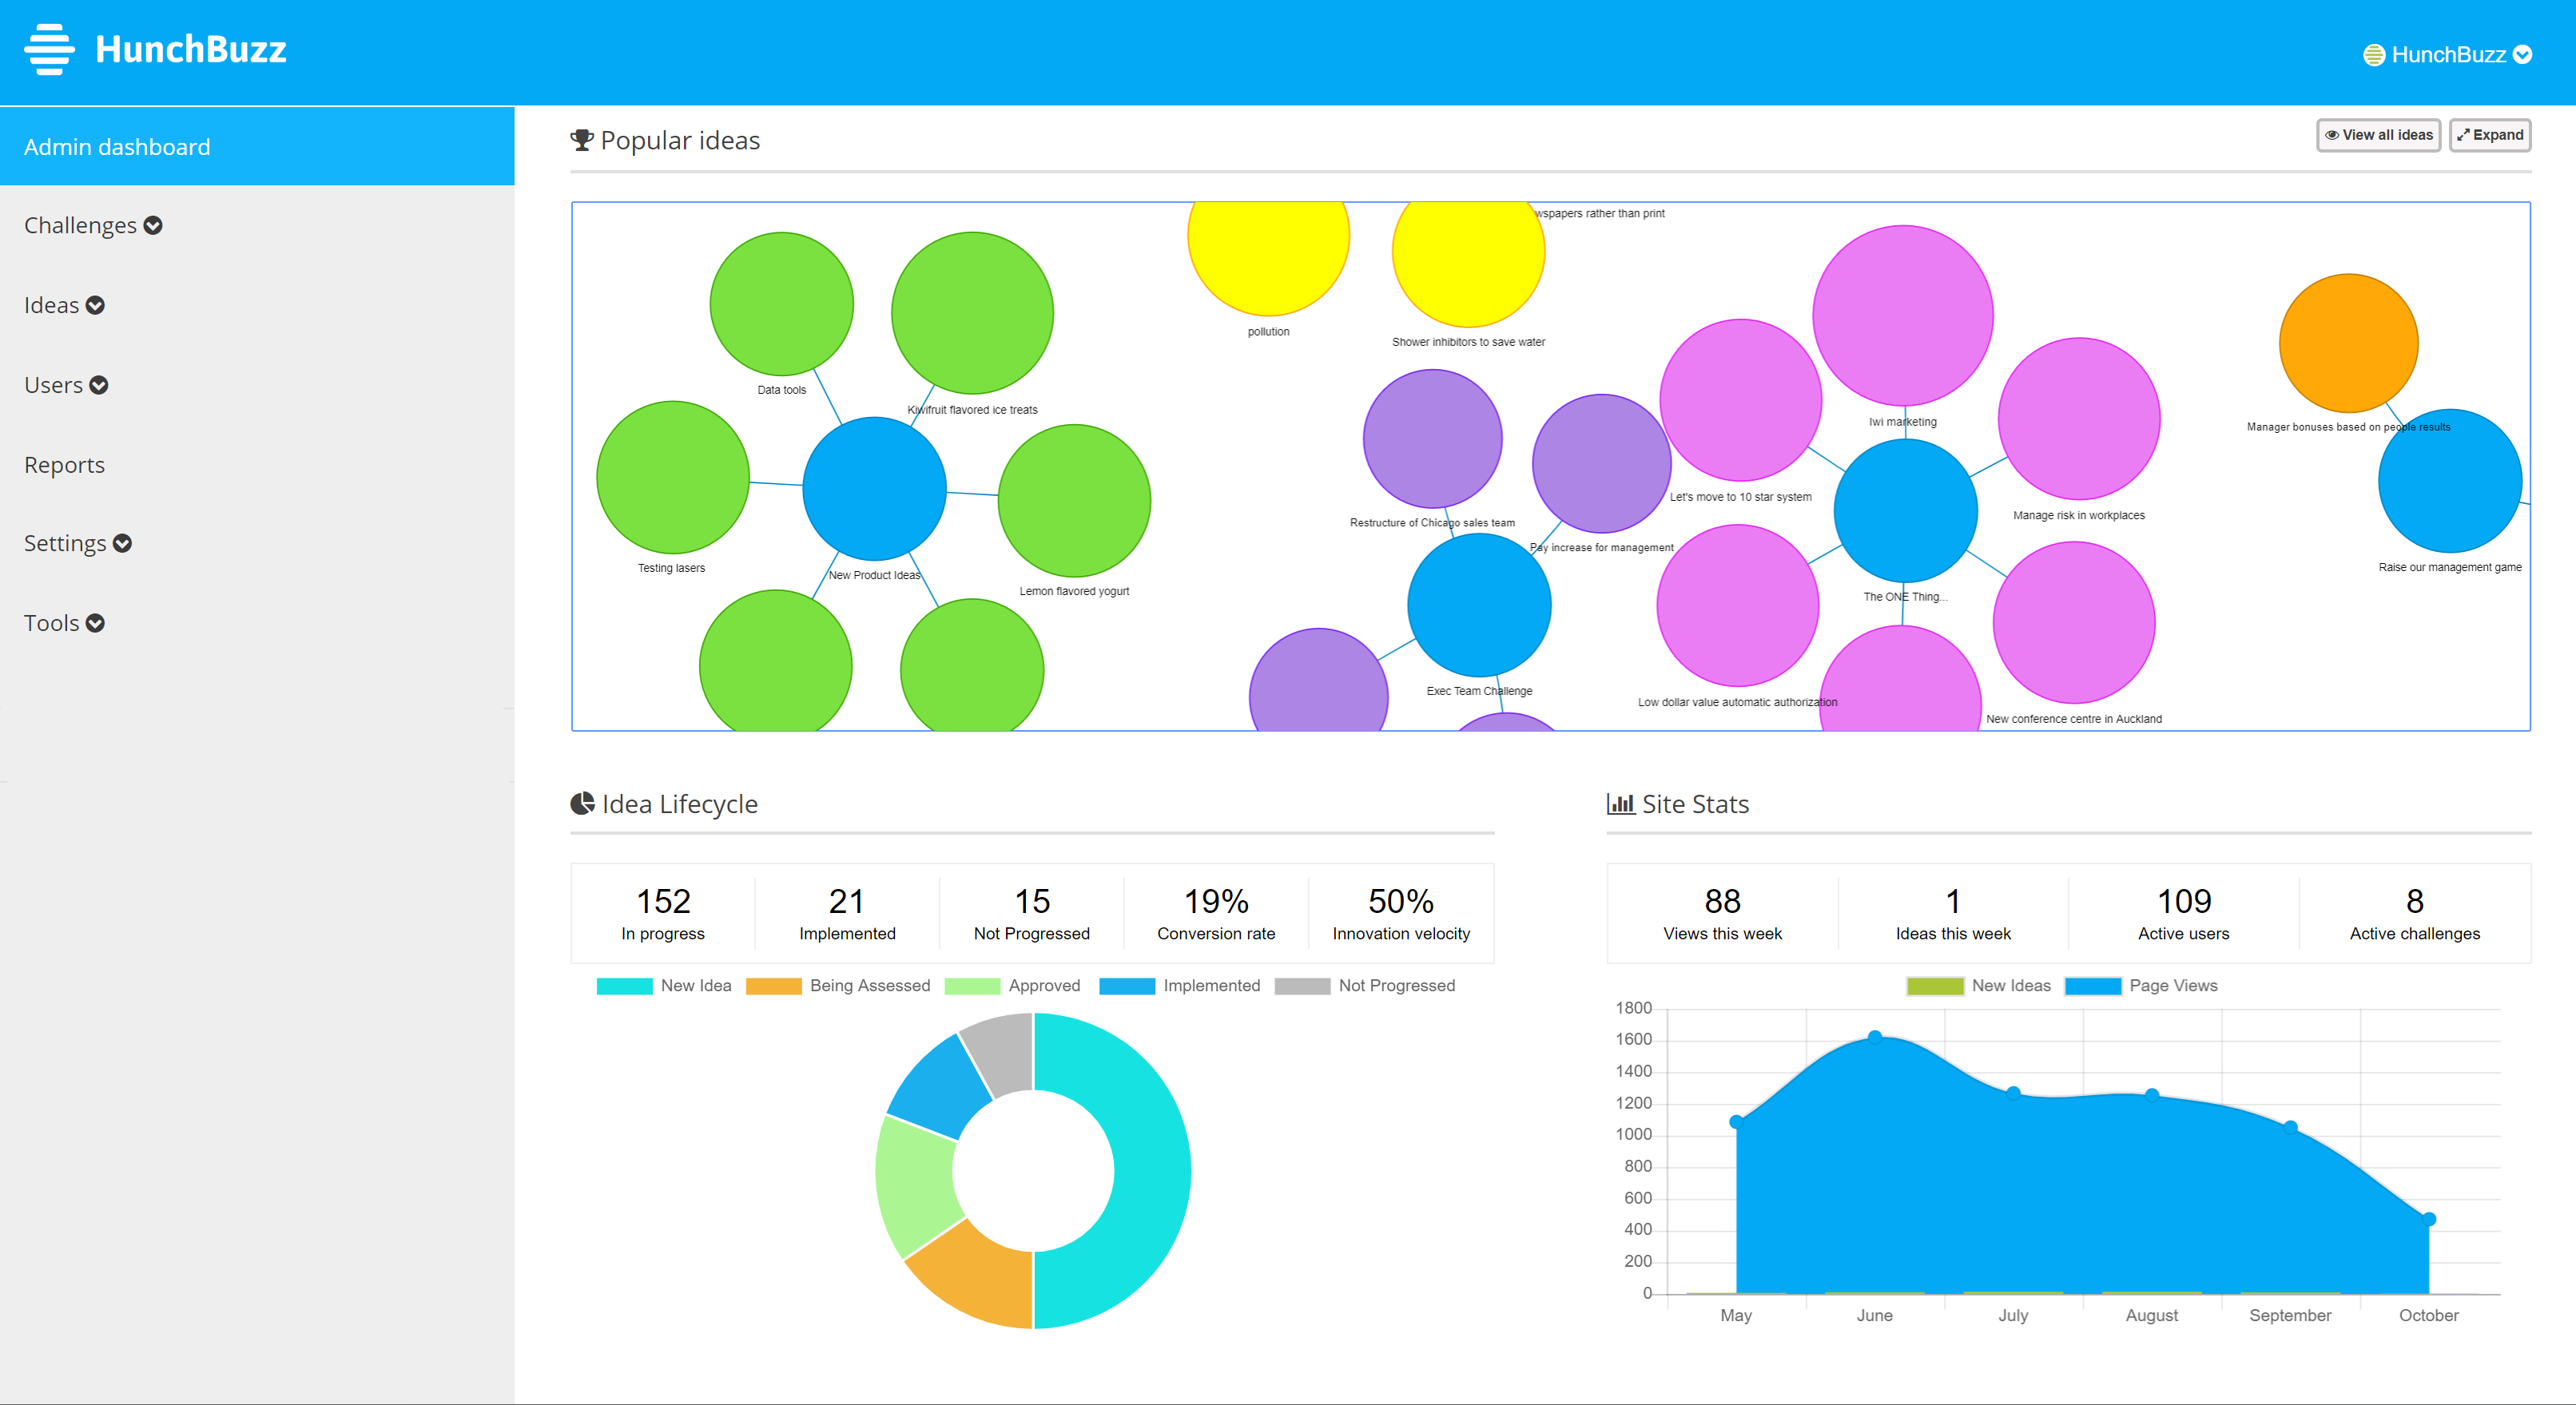
The dashboard
See all your community vitals in one place—the most popular ideas, the idea lifecycle, site stats and the leaderboard.
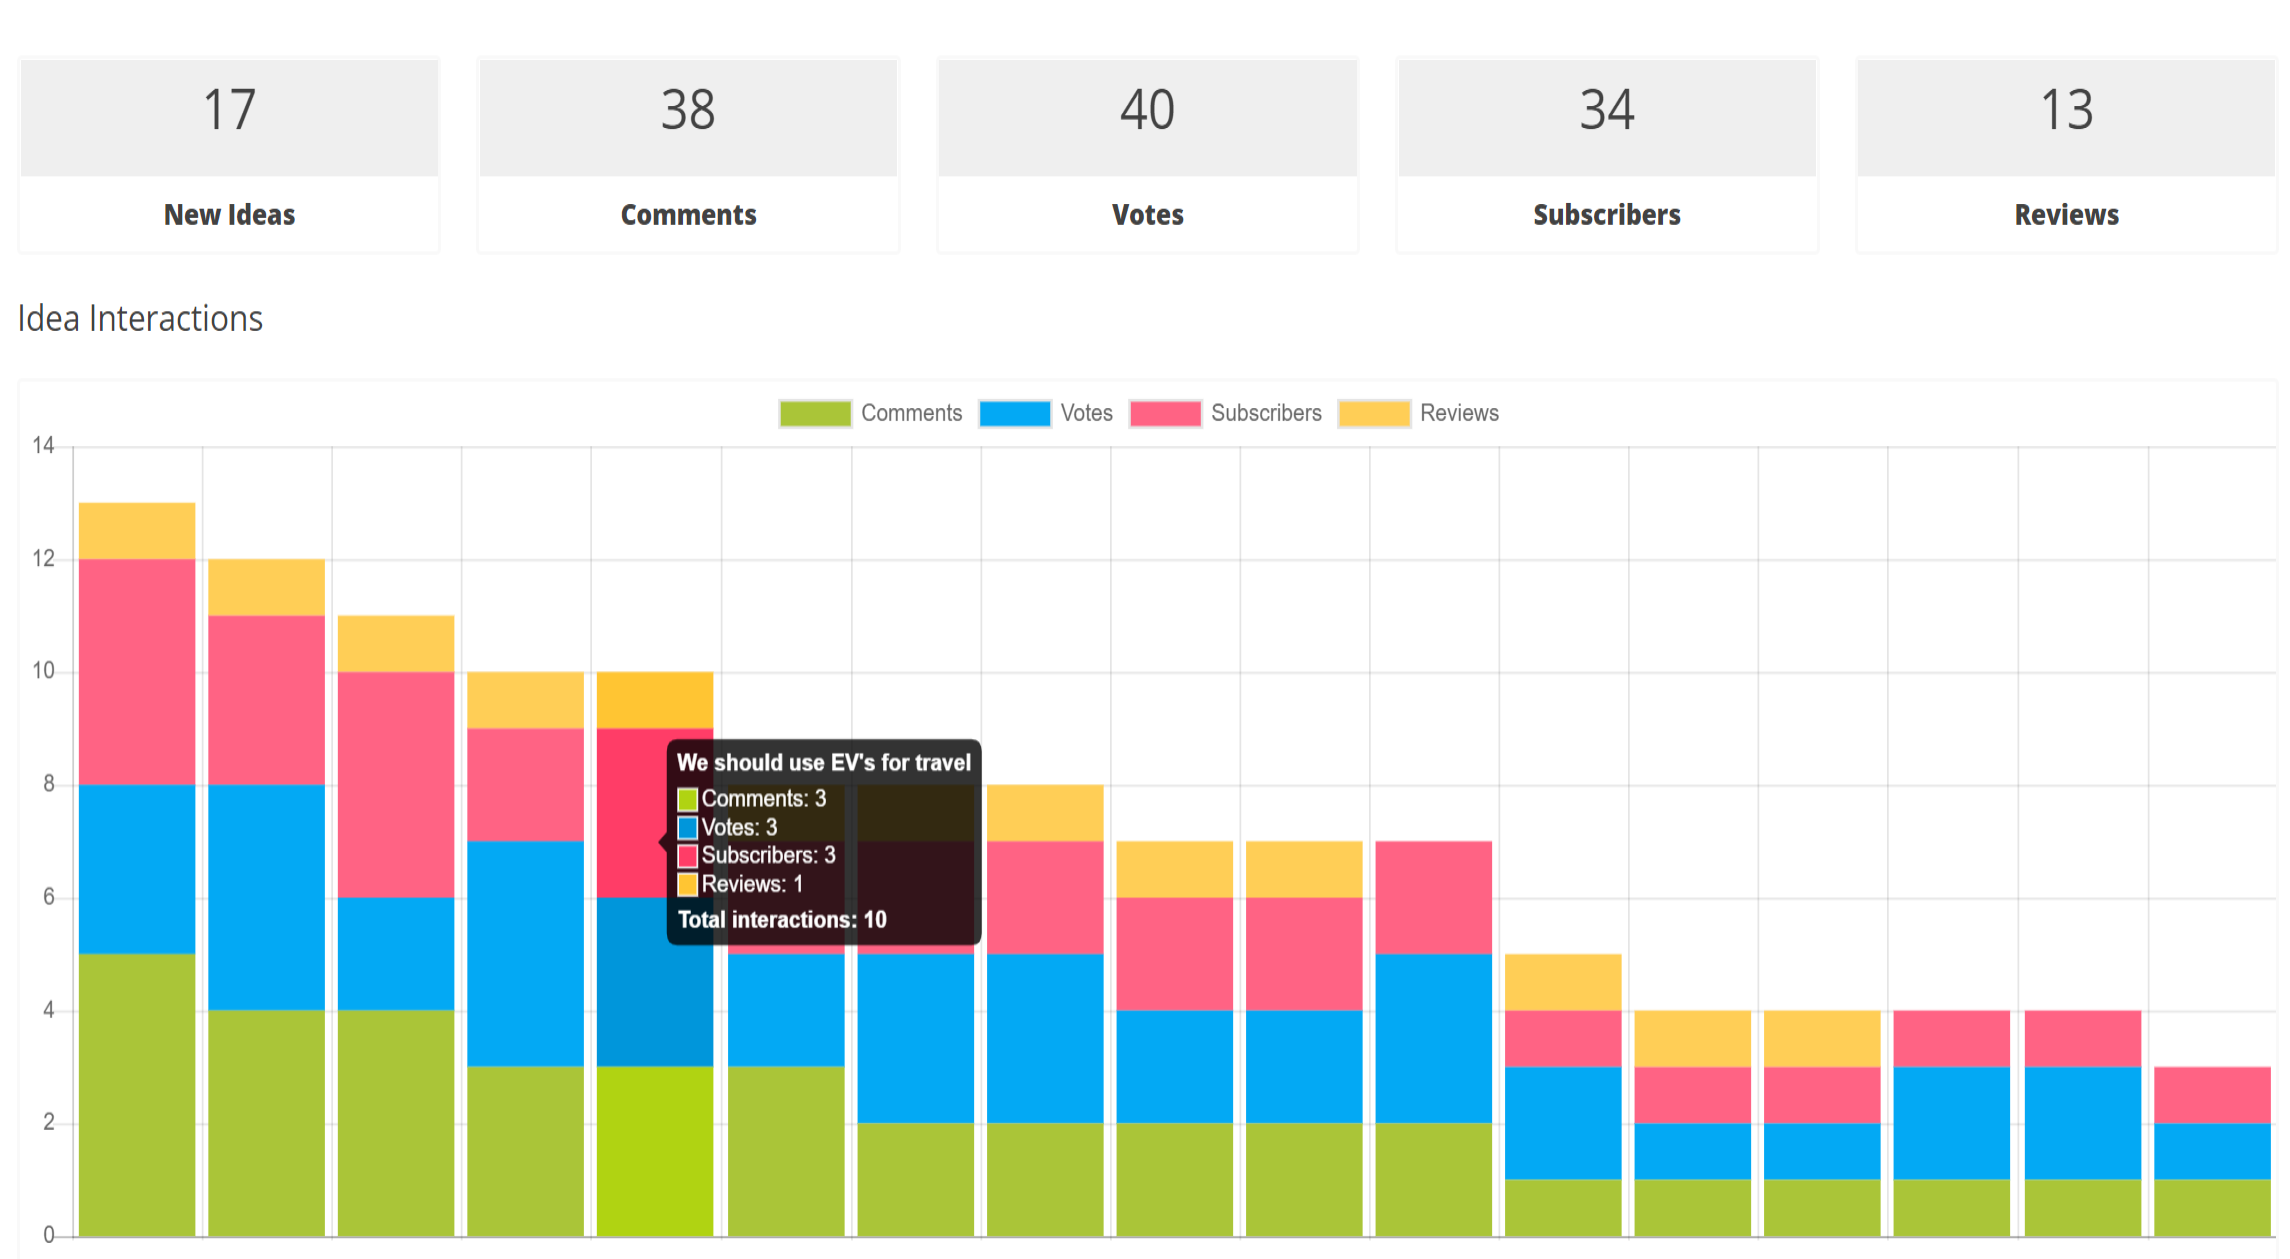
What's trending?
View the relative popularity of ideas and challenges. Determine which ideas are getting the most traction across all interaction types—votes, comments, reviews and page views
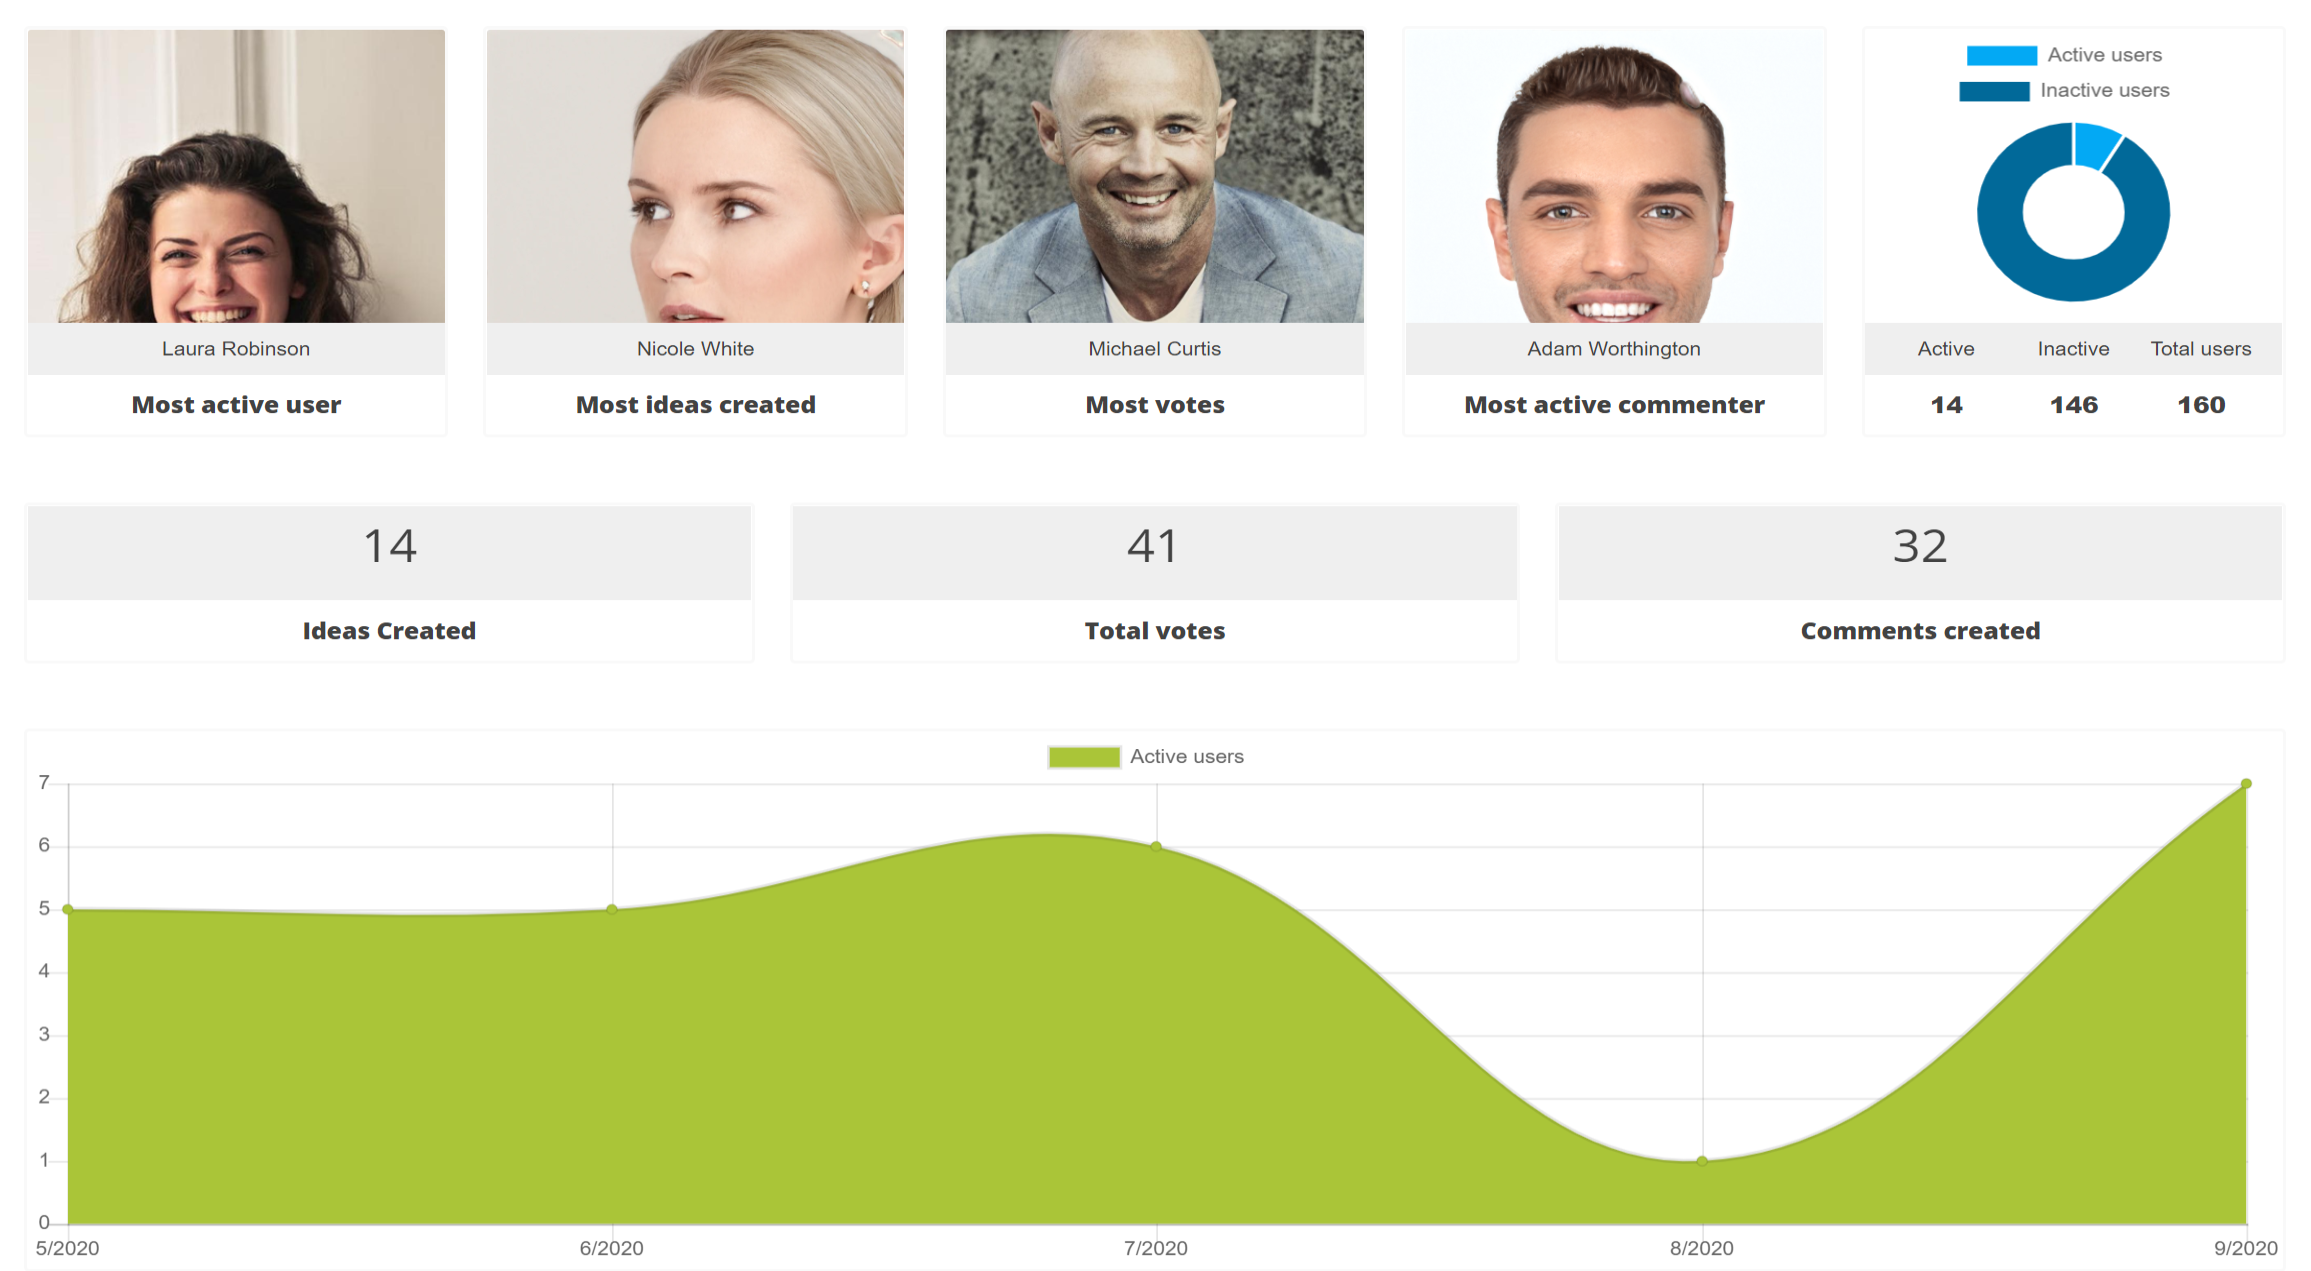
Who's engaged?
See the most active users for a given period and general usage over time. You can also view a bubble chart showing the most popular time periods of activity.
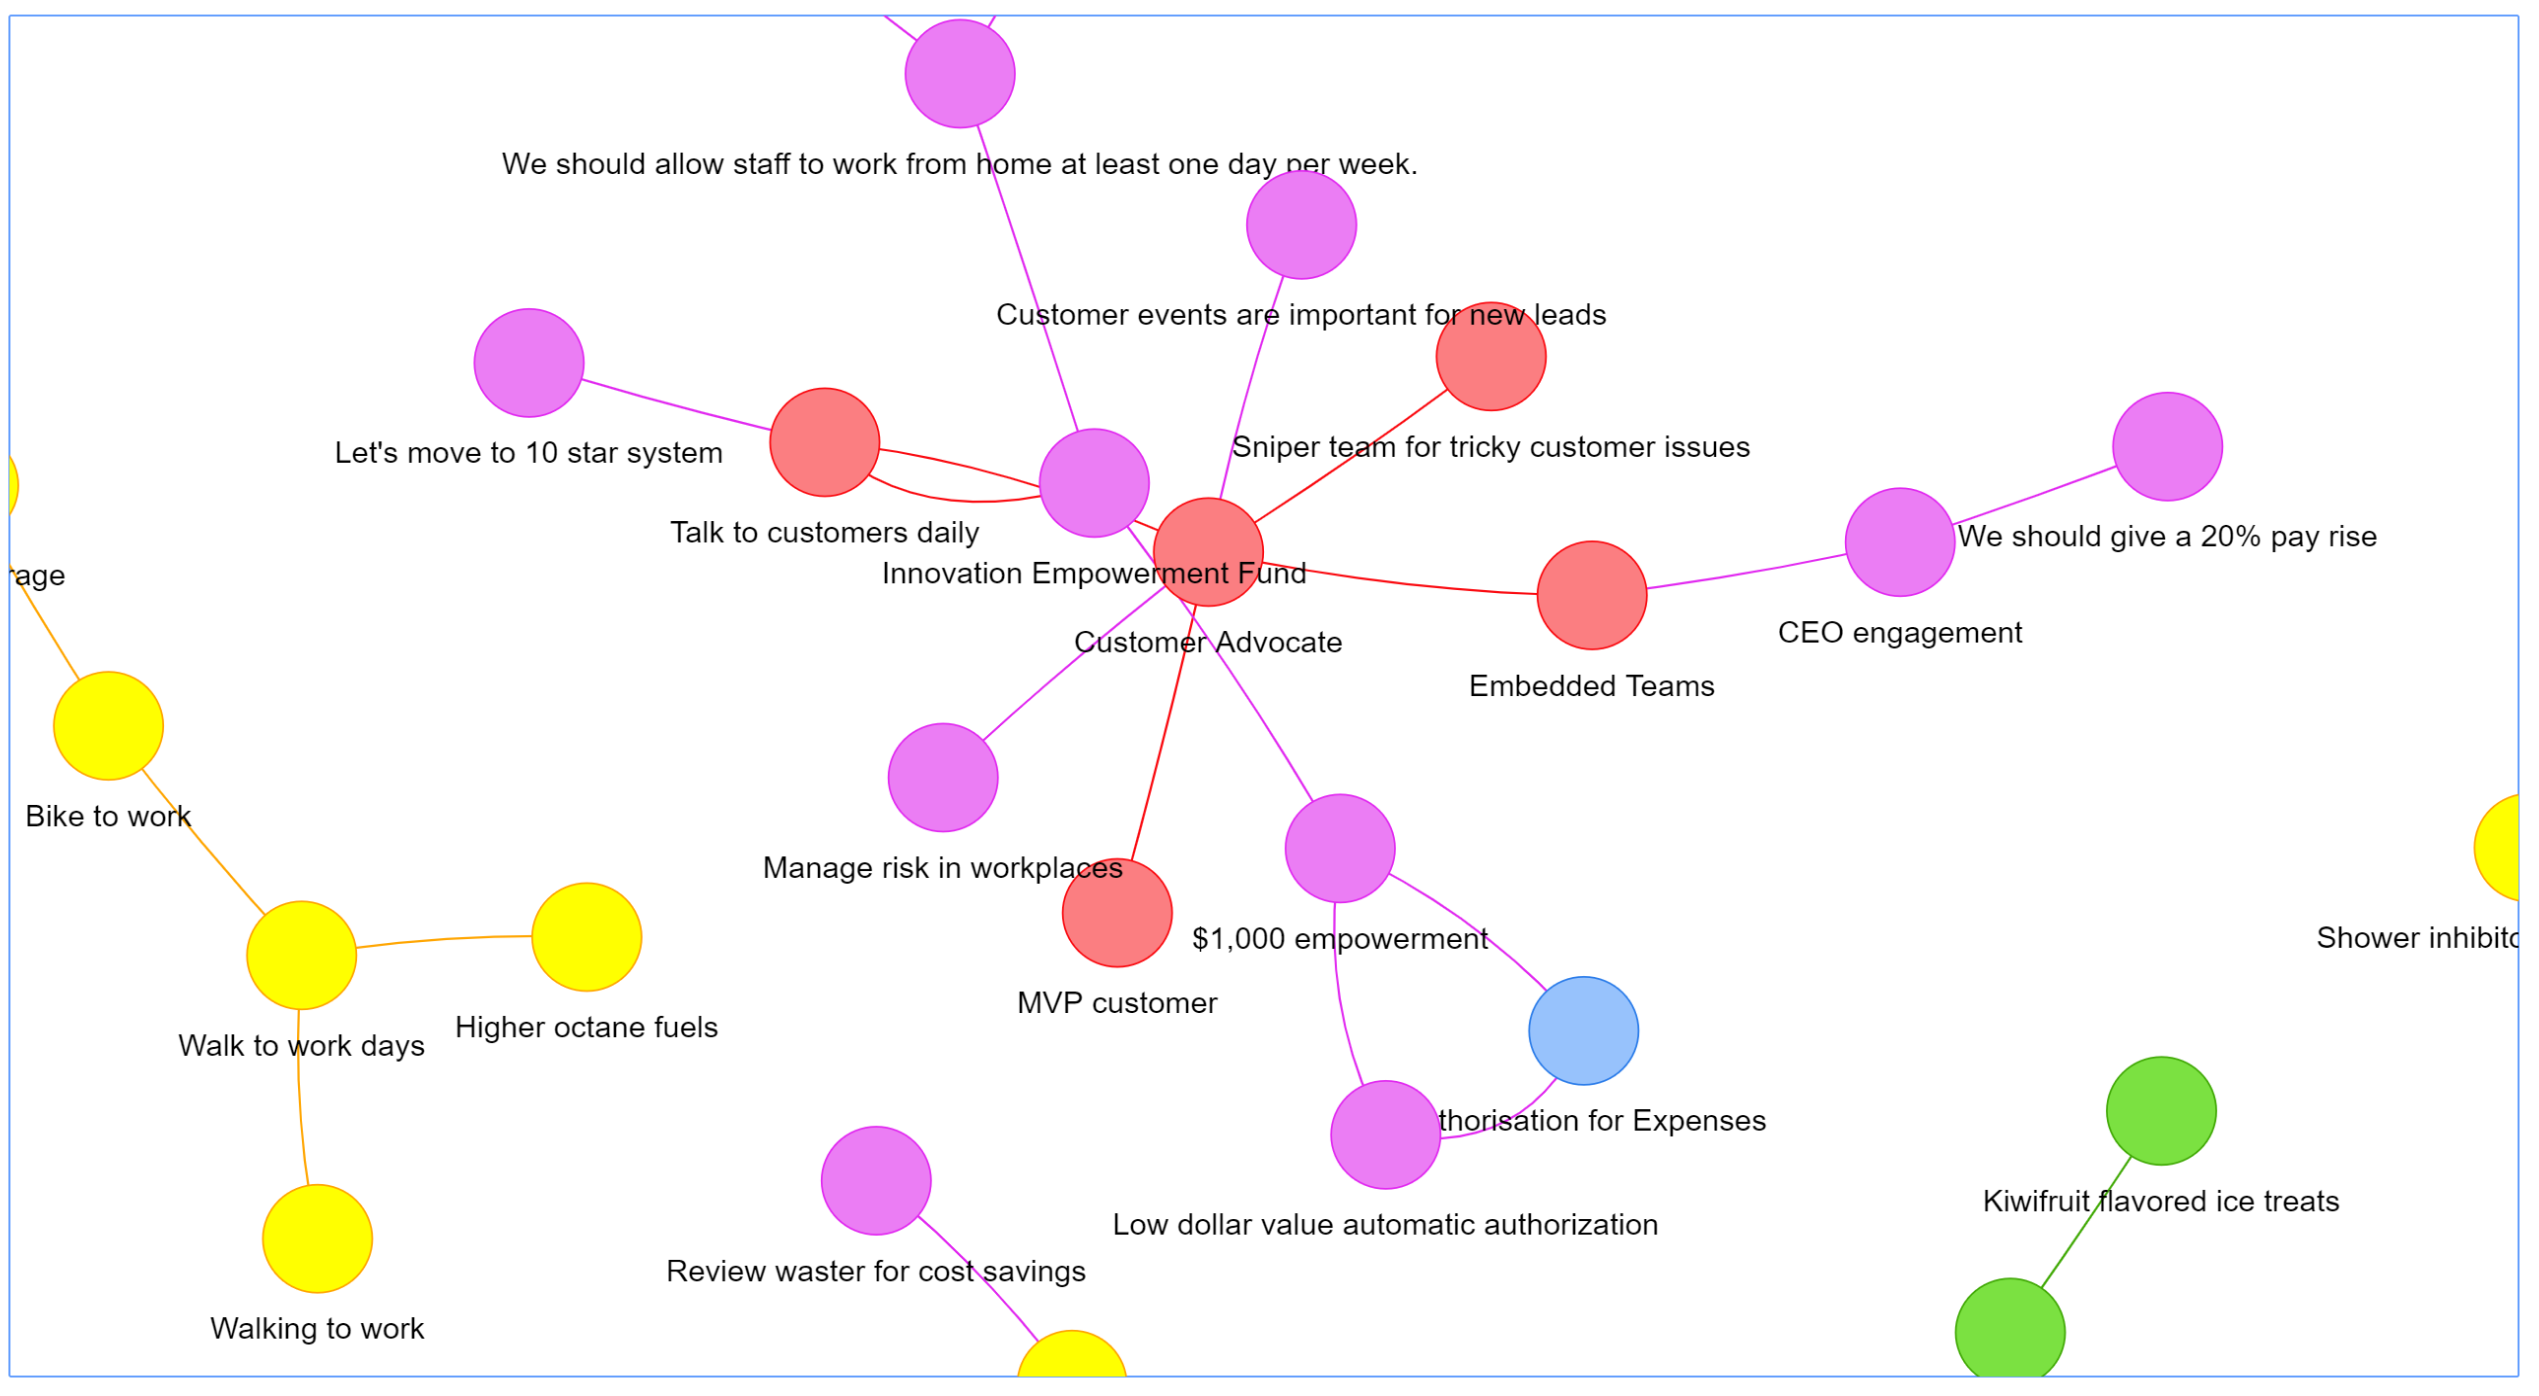
Idea explorer
See the relative popularity of ideas and explore the connections between them.
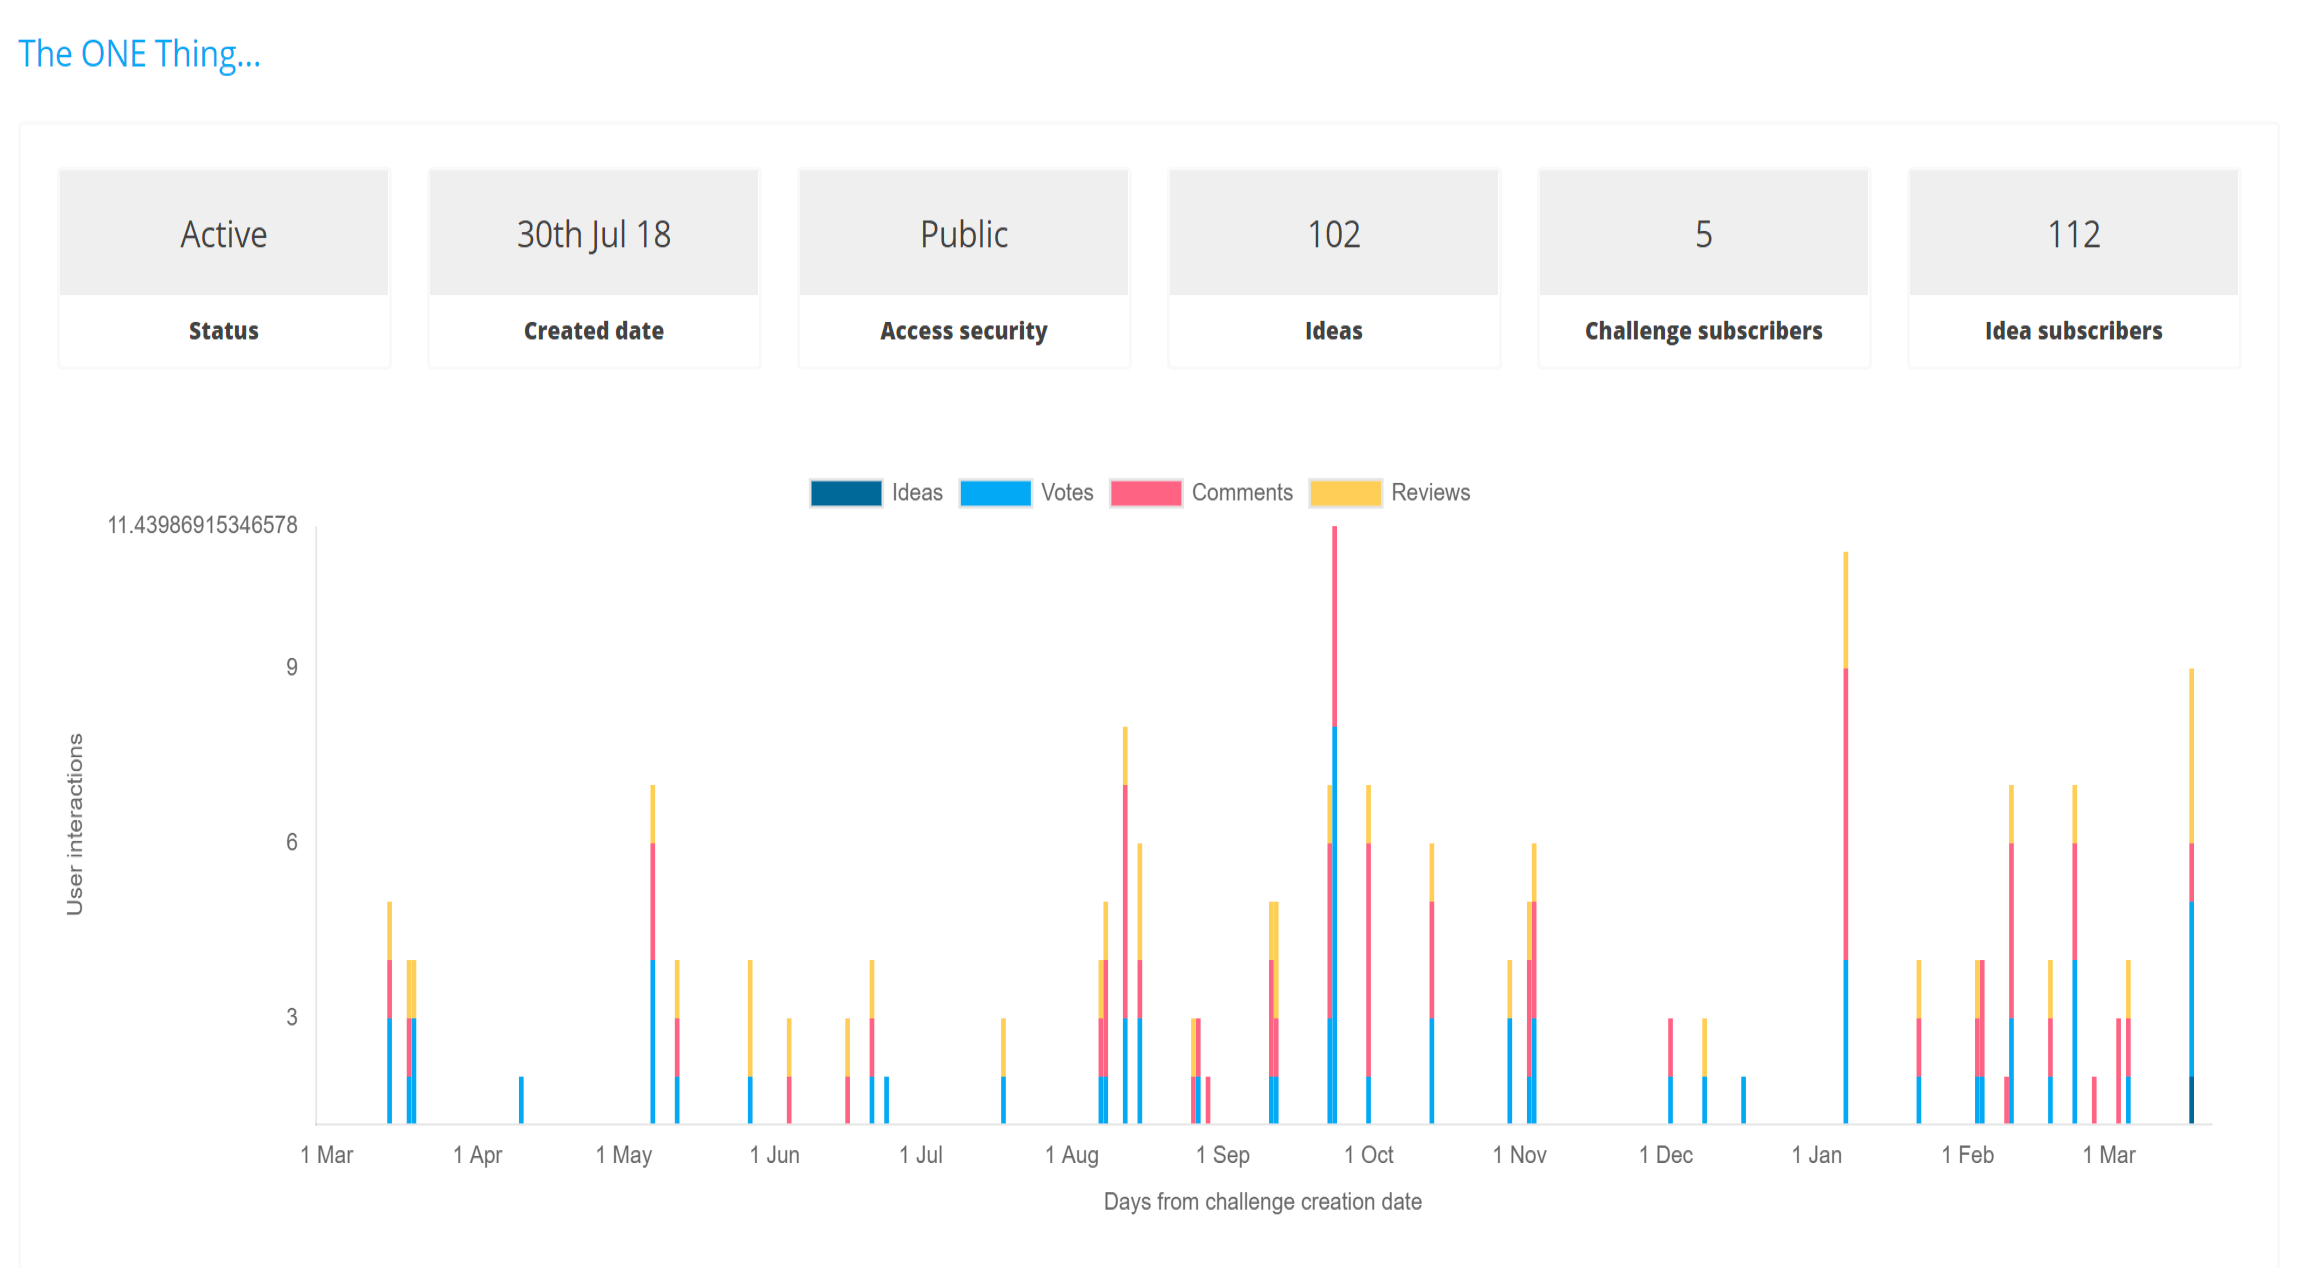
Inside the challenge
A detailed view of all challenge statistics including activity over time and of who responded and how they interacted with the challenge.
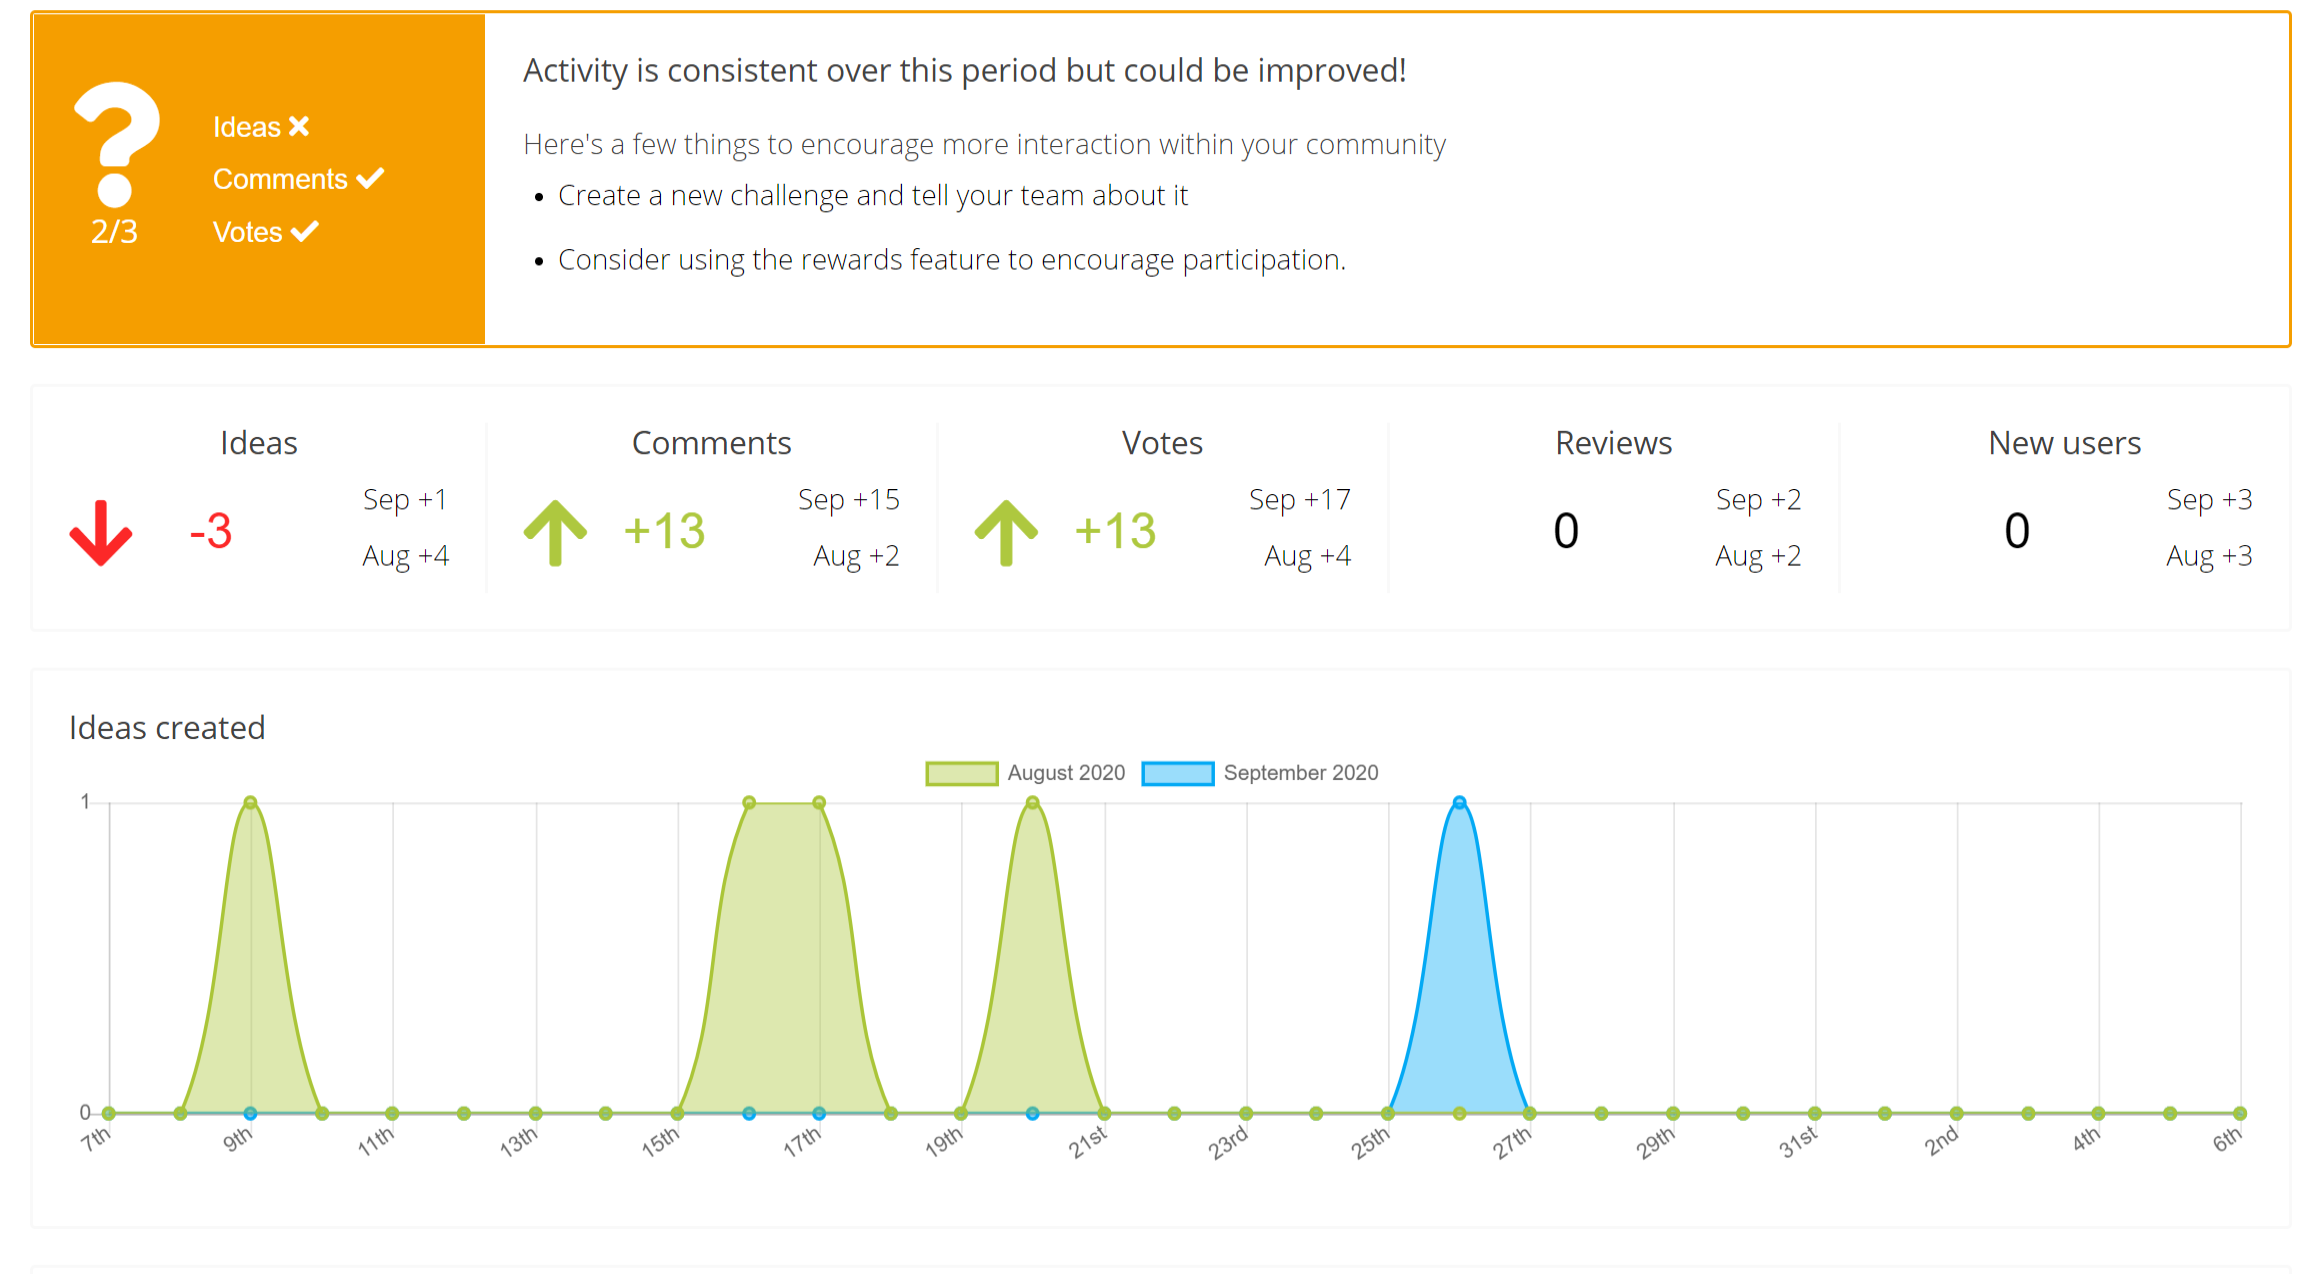
Healthcheck
A month to month report card-like comparison of activity so you can see whether engagement and participation are increasing or declining against major metrics.
Learn more about reporting and analytics.